Our leaders are fighting and the country suffers. Be brave. Stand up.
WELCOME TO THE HOME FOR THE COMMONSENSE MAJORITY
We are a national movement of commonsense Americans pushing our leaders together to solve our country's biggest problems.
NO LABELS
Our leaders are fighting and the country suffers. Be brave. Stand up.
We are a national movement of commonsense Americans pushing our leaders together to solve our country's biggest problems.
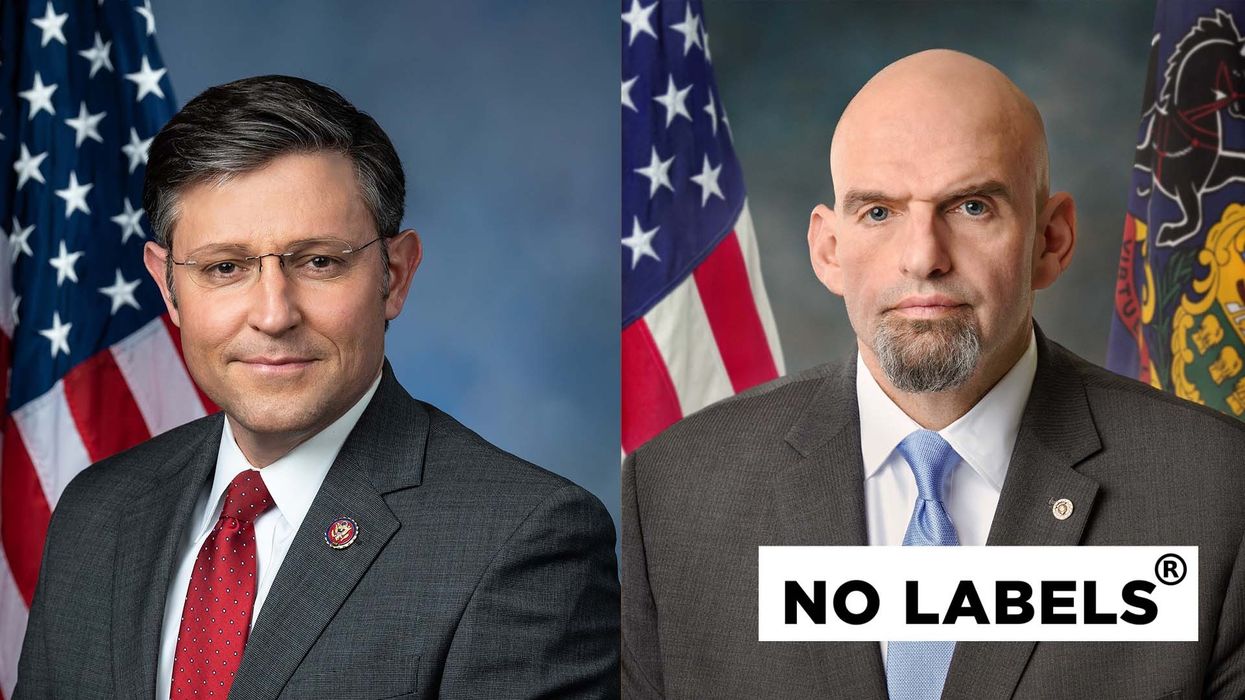
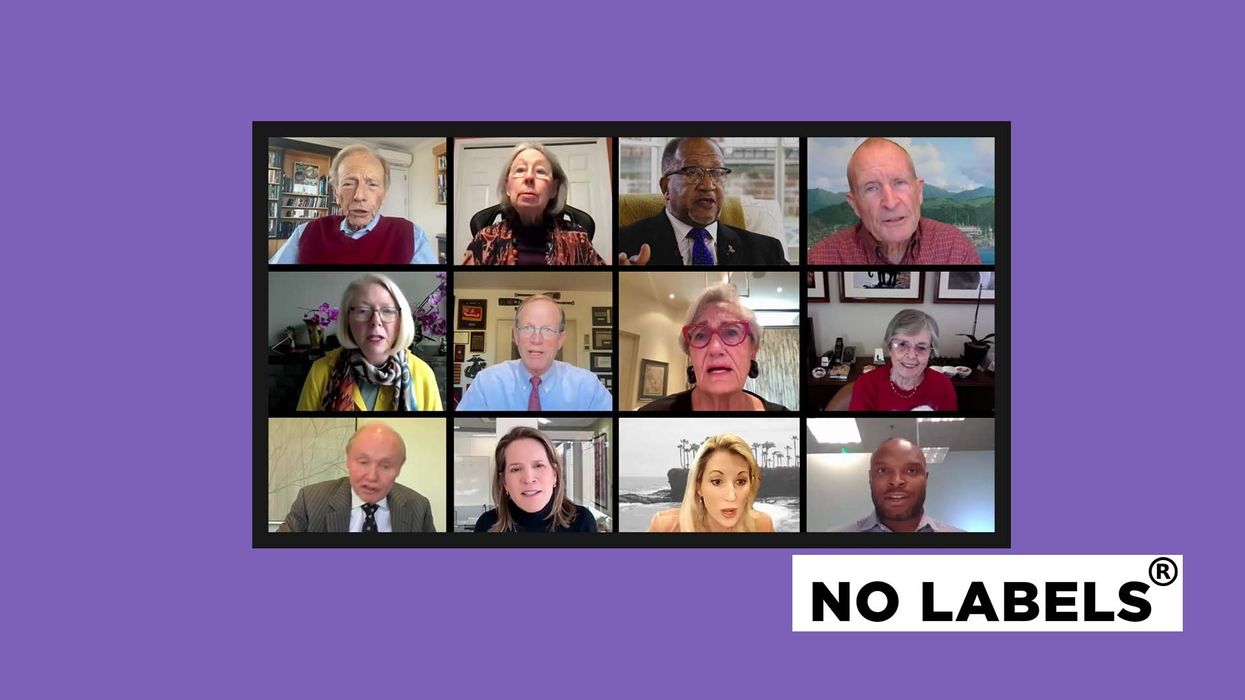
No Labels leaders gathered at the National Press Club in Washington, D.C., to detail an alleged unlawful conspiracy to subvert Americans’ voting rights.
WE ARE HARD AT WORK
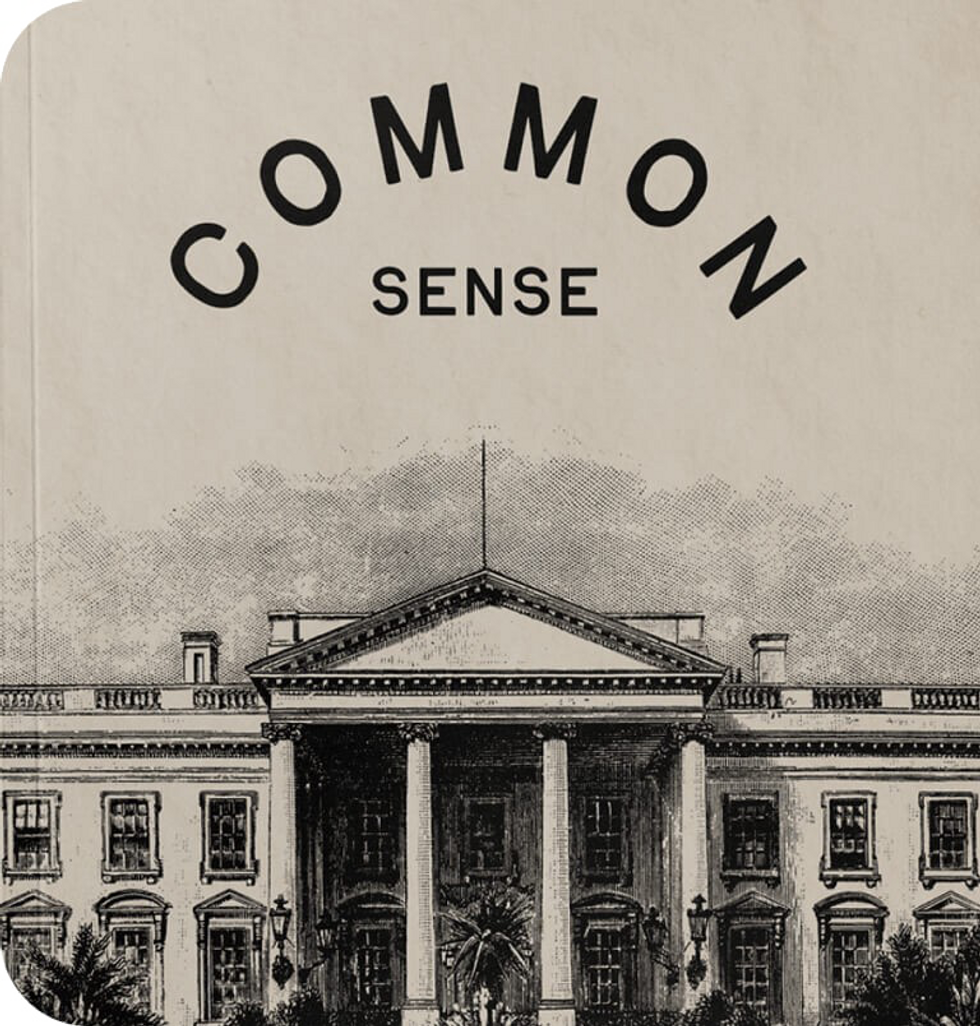
Download the Common Sense Policy Booklet — a clear blueprint, guided by the shared values and aspirations of Americans across the nation.
Add your voice to an organization of over 1 million Democrats, Republicans, and independents working in pursuit of a shared goal.

Have the courage to put country first.
Sign up if you believe we need a united front to solve our country’s biggest problems.
This moment demands American leaders and citizens alike declare their freedom from the anger and divisiveness that are ruining our politics and most importantly, our country.
Front

WE HAVE A PLAN
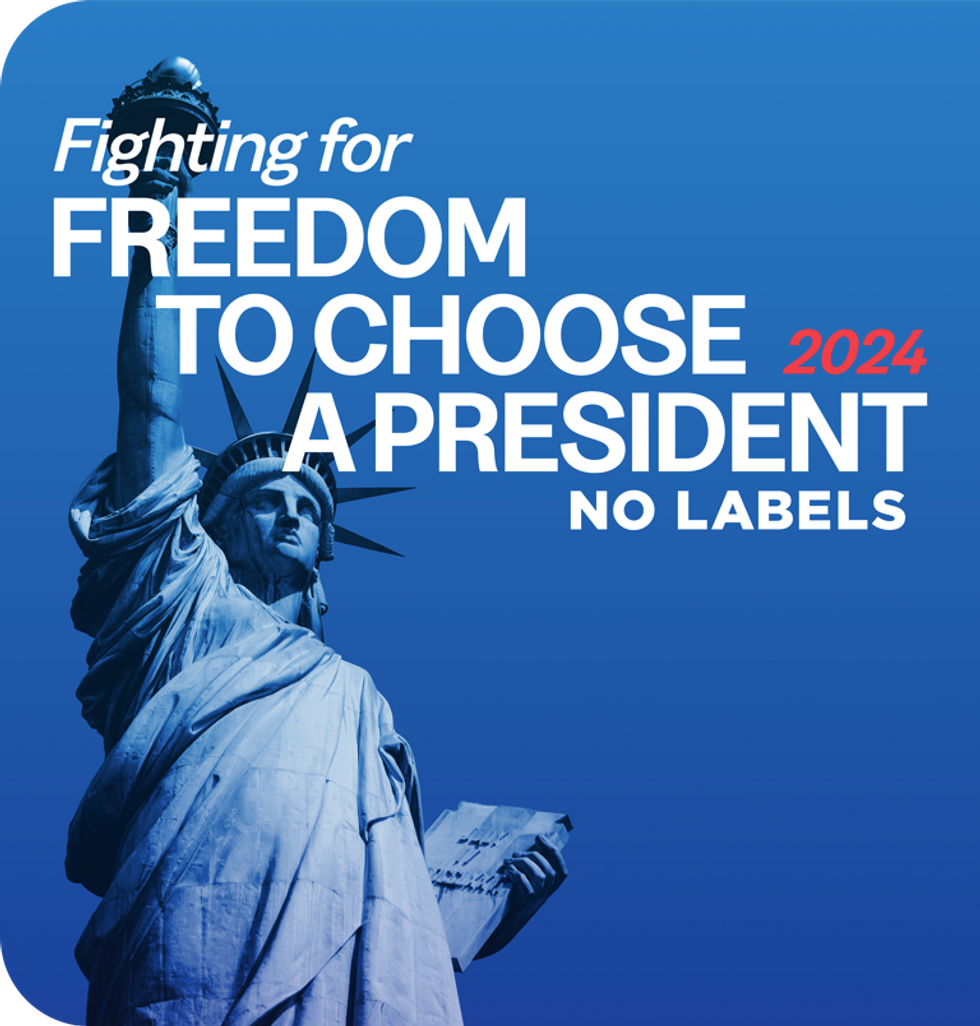
America deserves strong, honest and effective leaders in the White House who will commit to working closely with both parties to deliver commonsense solutions to America’s biggest problems. But most Americans don’t think either party is likely to offer that kind of choice for president in 2024.
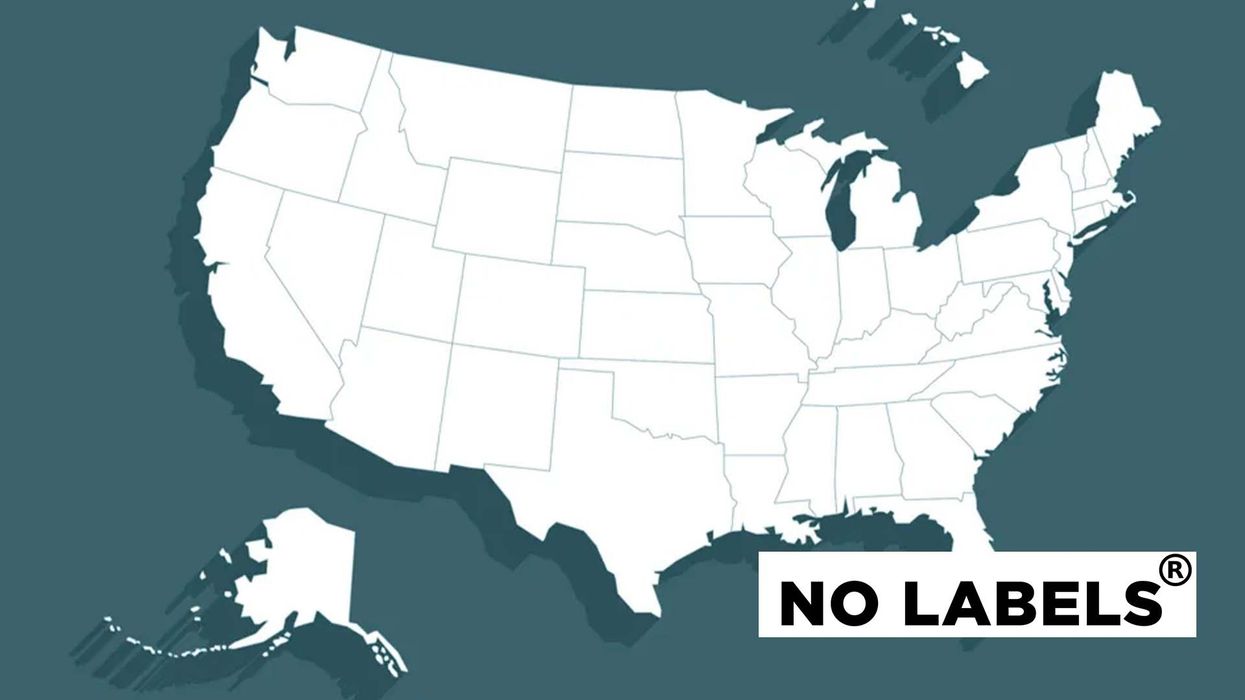
No Labels is preparing to offer a better choice. We are working to get on 2024 voting ballots in states across the country and we may offer our ballot line to a Unity presidential ticket if the American people demand it.
Are you one of the 3 in 5 Americans who want a better choice for president in 2024?
If so, learn more about the No Labels movement here.